

Most investors do not have a data problem.
They have a context problem.
A stock can look cheap until you compare it with its industry.
A company can report strong earnings while expectations are weakening.
A sector can be up for the month and still be losing leadership this week.
An options trade can look attractive until you see what the payoff actually requires.
The difficult part is rarely finding another number.
It is understanding where that number belongs.
That is the idea behind rhope.
Market data, in context.
rhope is structured as a research workflow rather than a collection of disconnected tools. Each part of the workspace is meant to answer a different question, and each question should lead naturally to the next one.
The path is simple:
Understand the market → Research a stock → Put it in context → Compare → Model → Discover → Monitor
You do not have to follow that sequence every time. But it explains why the workspace is organized the way it is.
Understand the market
Before looking at a company, it helps to understand the environment around it.
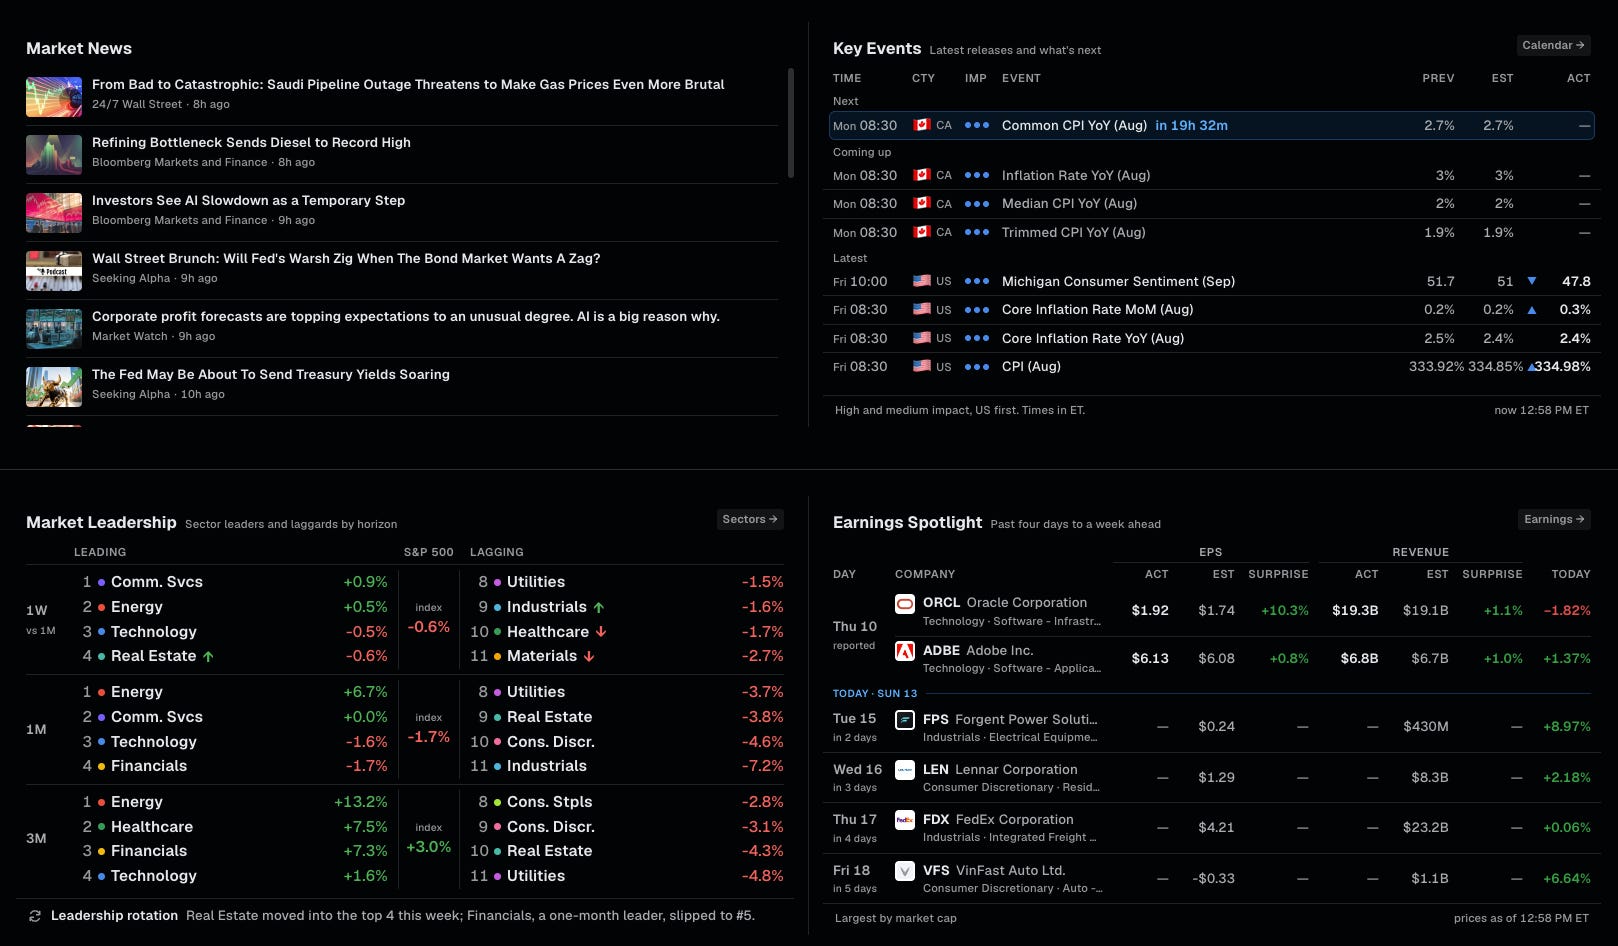
The Market workspace brings together:
major indices and sectors;
market news;
key economic events;
sector leadership;
earnings;
macro data;
commodities;
currencies;
crypto.
The goal is not to show everything happening in markets.
It is to answer a more useful question:
What deserves attention right now?
A stock does not trade in isolation. Rates, oil, currencies, sector rotation, earnings and macro events can change the context around the same company without changing the company itself.
That is why rhope starts with the market.
Research the company
Once a stock is worth investigating, the research becomes more specific.
A stock page brings the company into one place:
price and chart;
company profile;
financial statements;
valuation;
profitability;
growth;
estimates;
earnings;
transcripts;
options.
The purpose is not to replace analysis with a score.
It is to make the pieces of the company easier to inspect together.
A price chart tells you what the market has done.
Financial statements tell you what the business has done.
Estimates tell you what the market expects the business to do next.
Those are different questions, and they should remain different.
Put the number in context
This is one of the ideas rhope is built around.
A number by itself is rarely enough.
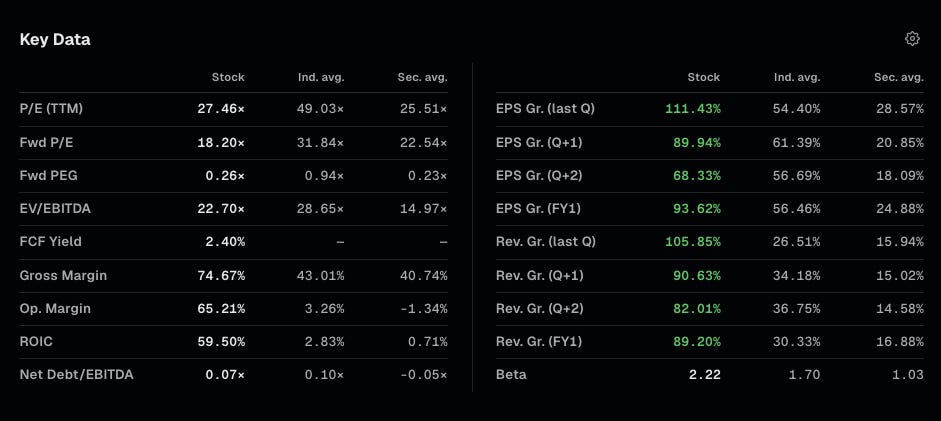
Imagine a stock trading at 20× forward earnings.
Is that expensive?
There is no useful answer until you ask:
What does its industry trade at?
What does its sector trade at?
How fast is the company growing?
What are its margins and returns on capital?
What is the market expecting next?
The same applies to growth, margins, ROIC, free-cash-flow yield and almost every other financial metric.
That is why rhope places company data next to industry and sector reference points.
The point is not to tell you whether a stock is good or bad.
The point is to make the comparison visible.
The number is the starting point. The comparison is where the research begins.
Compare alternatives
Sometimes the best way to understand a company is to put another company beside it.
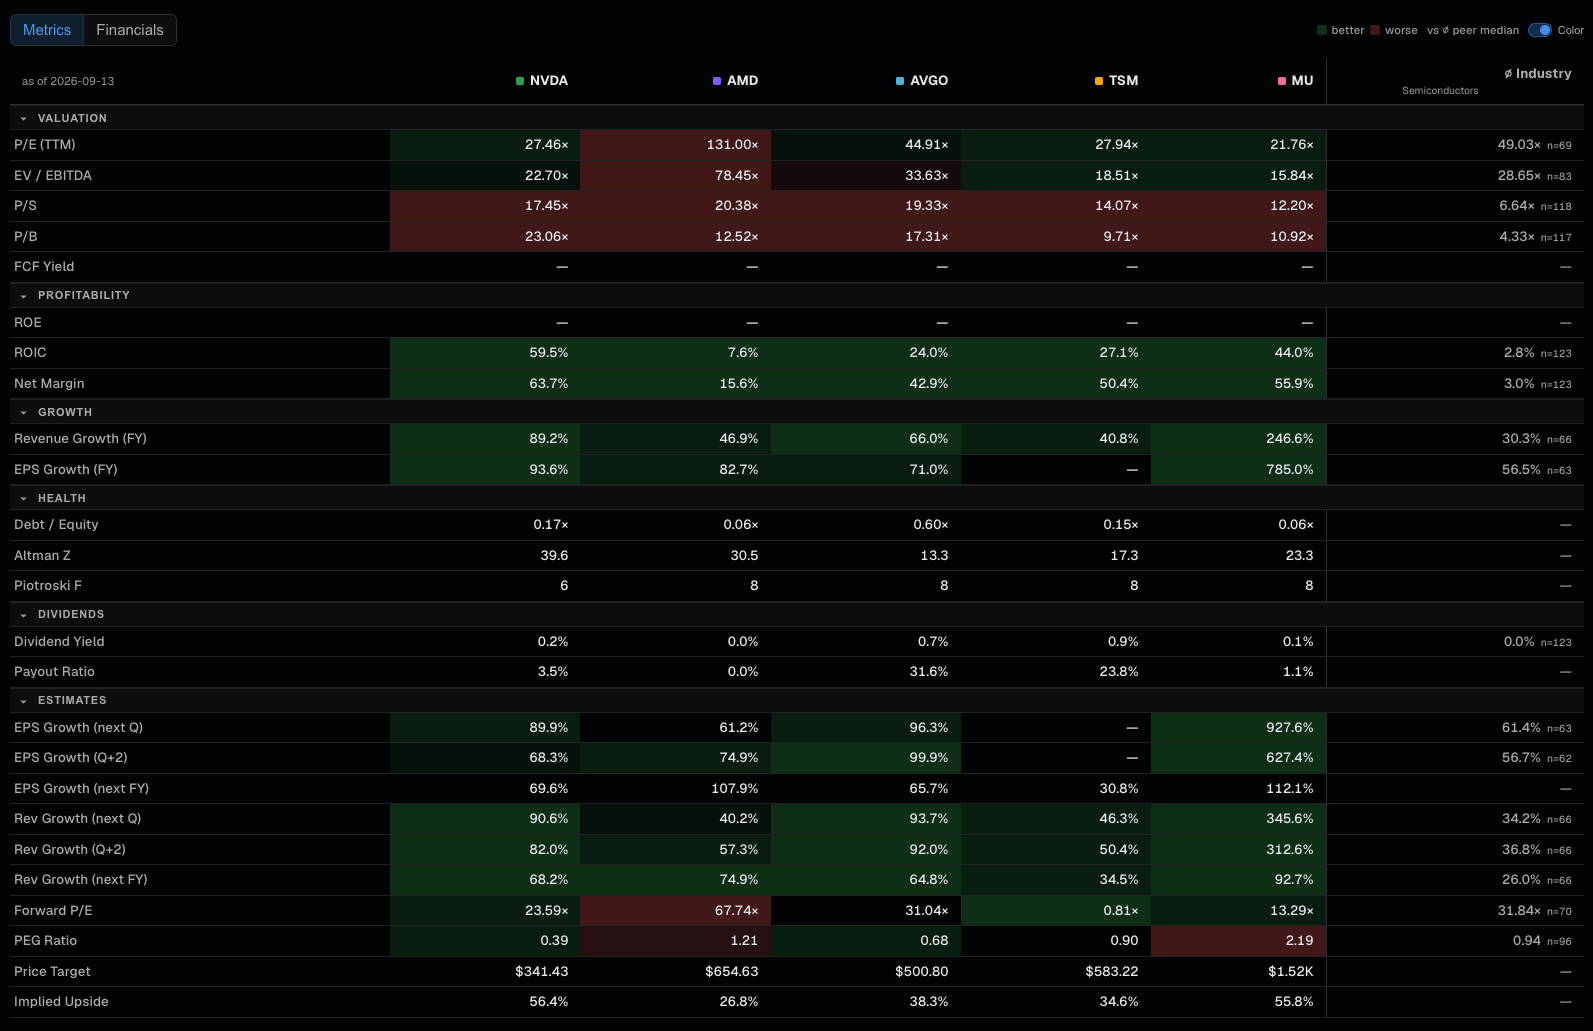
The Compare workspace is built for questions such as:
Why does one company trade at a higher multiple?
Which business has stronger margins?
Is one company growing faster?
Does the valuation gap match the difference in fundamentals?
Are two stocks being treated differently by the market for a good reason?
This matters because investment decisions are often relative.
You are rarely choosing between a stock and nothing.
You are choosing between different uses of capital.
A comparison should make the differences easier to see without pretending that one column automatically contains the answer.
Model the trade
Researching a company and expressing a view are not the same thing.
That distinction matters especially with options.
The Options workspace is designed to help inspect:
the option chain;
implied volatility;
expected move;
Greeks;
strategy structure;
payoff at expiry.
A bullish view can still produce a poor trade if the price paid, volatility or payoff structure is unfavorable.
A bearish view can have the same problem.
So rhope separates the question:
What do I think about the company?
from:
How does this trade behave if I am right — or wrong?
The payoff is part of the research.
Discover the next idea
Research does not always start with a ticker.
Sometimes it starts with a condition.
You may want to find:
companies in an industry;
stocks with high ROIC;
businesses growing faster than their peers;
companies trading below an industry valuation;
a group exposed to a macro theme.
That is where Screener, Earnings, Calendar and the broader Discover tools fit.
The purpose of the Screener is not to produce a list of stocks to buy.
It is to reduce a large market into a smaller set of companies worth investigating.
The result of a screen should be the beginning of research, not the end of it.
Monitor what matters
Research is not finished when a position is opened or a stock is added to a watchlist.
Things change.
Prices move.
Estimates change.
A company reports.
An industry loses leadership.
A macro event changes the backdrop.
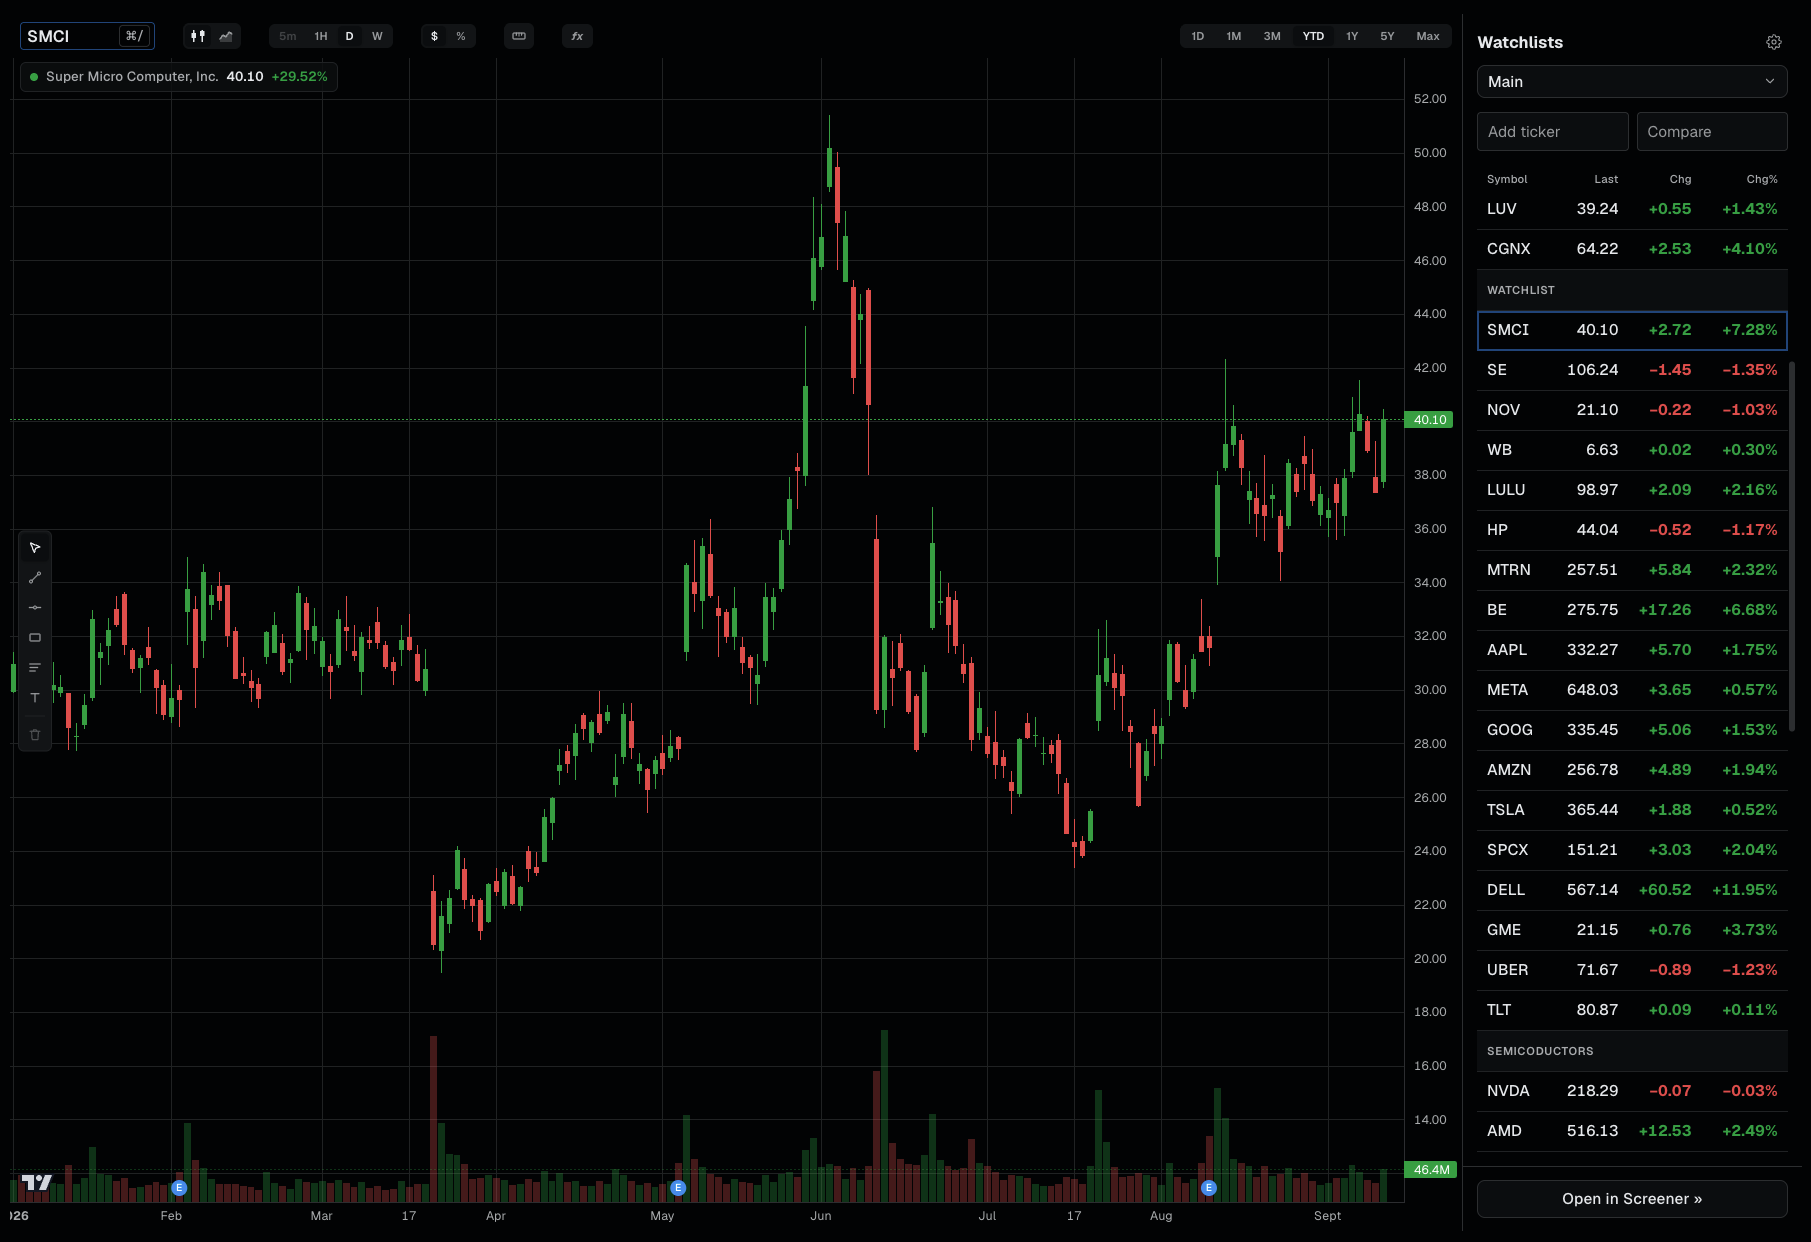
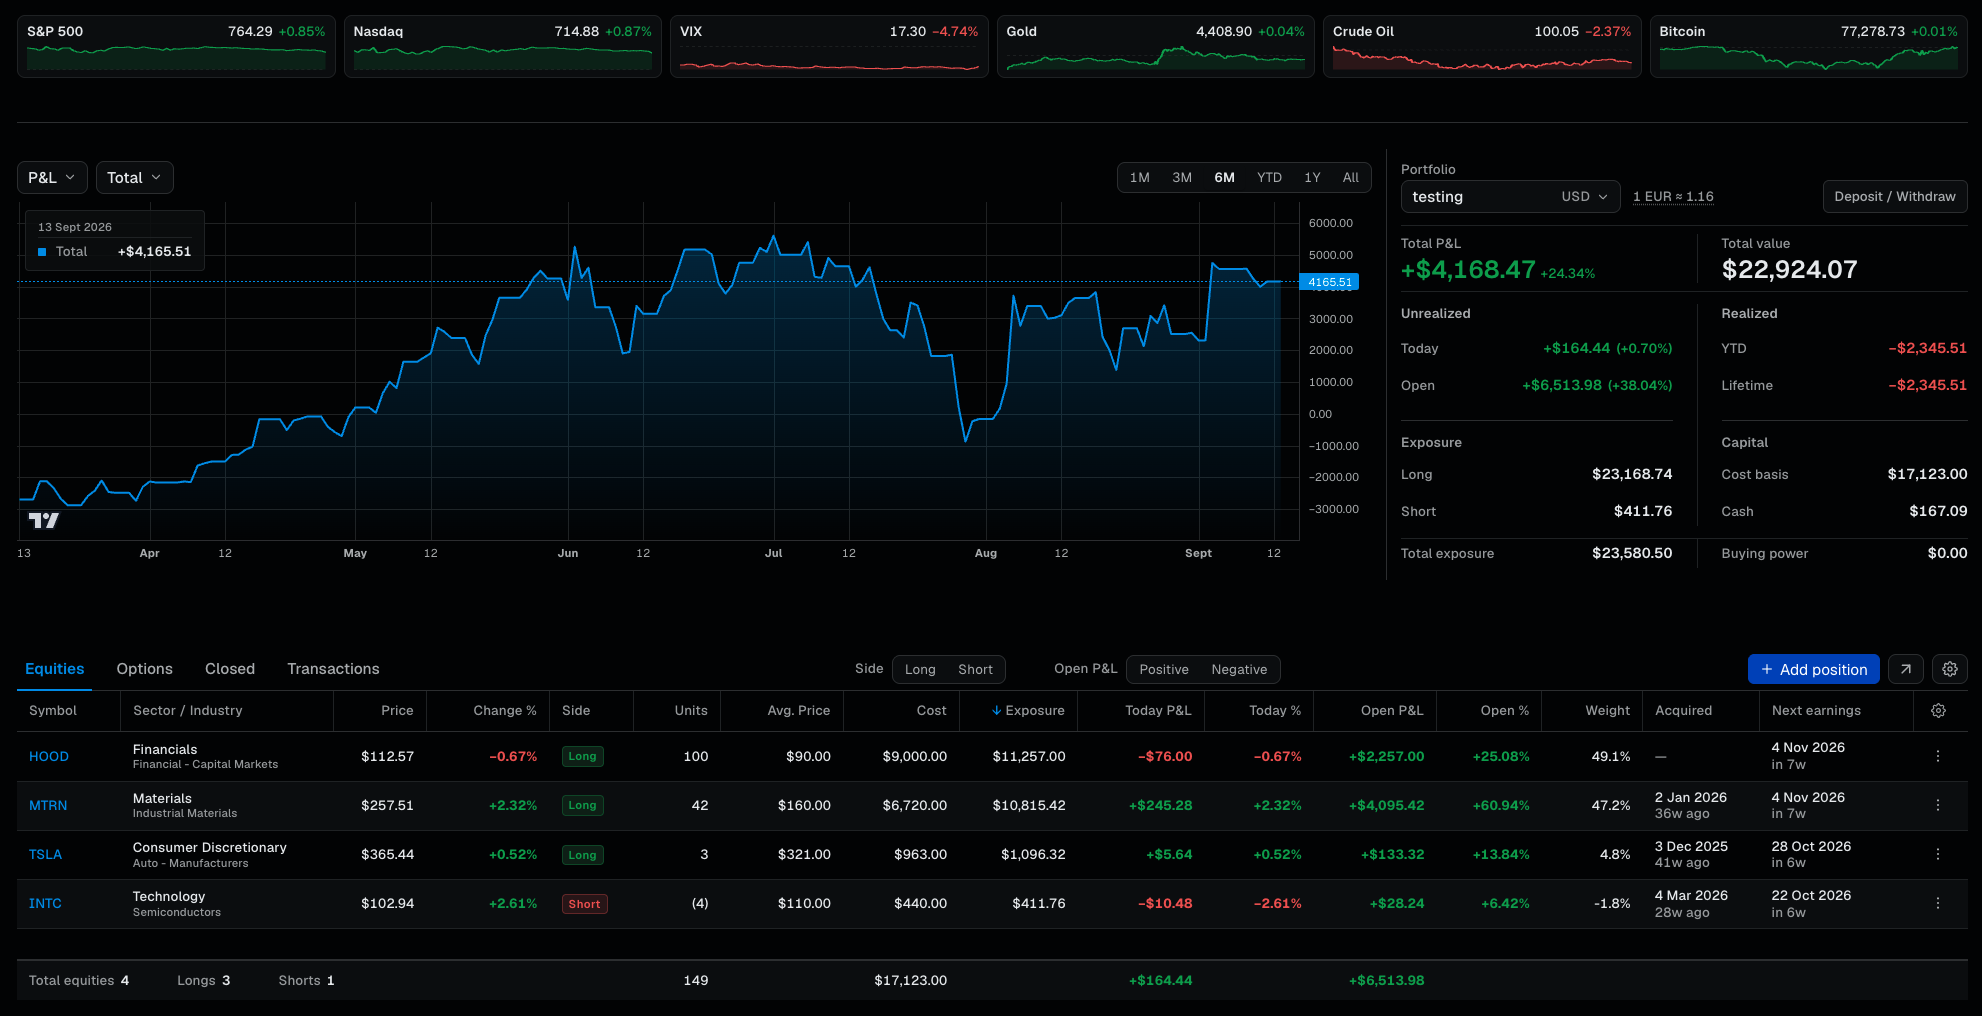
The Monitor side of rhope — watchlists, portfolios, news and alerts — exists to make those changes easier to follow.
The goal is not constant activity.
It is the opposite:
Know when something relevant has changed so you do not have to watch everything all the time.
One workspace, one research loop
The structure can be reduced to seven questions:
Step. Question
Market What is happening?
Stock What kind of business am I looking at?
Context Is this number actually high, low, strong or weak?
Compare How does it differ from the alternatives?
Model How does the trade behave?
Discover Where else does this setup exist?
Monitor What changed?
That is the workflow rhope is built around.
Not every research session begins at the top.
You may arrive with a ticker already in mind.
You may start from an earnings report.
You may discover a company through the Screener.
You may open rhope because oil moved sharply or because a stock on your watchlist reported.
The entry point changes.
The principle does not:
Put the information in context before making the call.
What rhope does not try to do
rhope is not designed to tell you which stock to buy.
It does not try to turn financial research into a single score, prediction or signal.
Markets are uncertain, and the same data can support different conclusions depending on price, horizon, risk and expectations.
The job of the workspace is narrower:
organize the evidence, make the comparisons visible, and reduce the amount of context you have to reconstruct yourself.
You make the call.
Start anywhere
If you already know the company, find a stock.
If you want to understand the current environment, open Market Overview.
If you have a thesis but no ticker, start with the Screener.
If you are choosing between two companies, open Compare.
If you are structuring an options position, use the Options workspace and payoff simulator.
And if you are already following something, add it to a Watchlist or Portfolio.
There is no required starting point.
There is only a research loop.
I write these notes to explain how the numbers and tools in the workspace are made, how they fit together, and how to read them — never to tell you where a market or a stock will go.
Descriptive only — nothing here is investment advice, a recommendation, or a trading signal. See our Terms.