

Revenue tells you how much a company sells.
Margins tell you how much of those sales become profit.
But neither tells you how much capital the business needed to produce those profits.
That is where ROIC — return on invested capital — becomes useful.
At a high level, ROIC asks:
How effectively does this business turn invested capital into operating profit?
That makes it one of the most useful metrics for understanding business quality.
But, like any single number, it needs context.
What ROIC actually measures
A simplified version is:
ROIC = NOPAT / Invested Capital
where:
NOPAT is net operating profit after tax;
Invested Capital is the operating capital committed to the business.
The intuition is simple.
If a company earns roughly $200 million of after-tax operating profit on $1 billion of invested capital, its ROIC is about:
20%
In other words, the business is generating roughly $0.20 of operating profit for every $1 of capital invested.
That does not tell you whether the stock is attractive.
But it tells you something important about the economics of the business.
How much does the company earn relative to what it needs to invest?
Why ROIC can be more useful than ROE
ROE — return on equity — measures profit relative to shareholder equity.
That can be useful, but it is heavily influenced by capital structure.
A company can increase ROE by using more debt or reducing its equity base through buybacks.
That does not necessarily mean the underlying business has become more efficient.
ROIC looks more broadly at the capital invested in the operating business.
So the two metrics answer different questions:
ROE asks how efficiently shareholder equity is producing profit.
ROIC asks how efficiently the capital in the business is producing operating profit.
When comparing companies with different balance sheets, ROIC can often provide a cleaner starting point.
Why high ROIC matters
A company that consistently earns high returns on capital has an important advantage.
If it can also reinvest at similar returns, the business has the ingredients for compounding.
Imagine two companies.
Company A
ROIC: 25%
Revenue growth: 15%
Company B
ROIC: 7%
Revenue growth: 15%
Both are growing at the same rate.
But Company A may be creating that growth much more efficiently.
Company B may need to keep adding large amounts of capital just to produce the same headline growth.
That is why growth alone does not tell you the quality of the growth.
A company that earns high returns on capital and can keep reinvesting at those returns has the ingredients for compounding.
The harder question is whether those returns are durable.
ROIC needs industry context
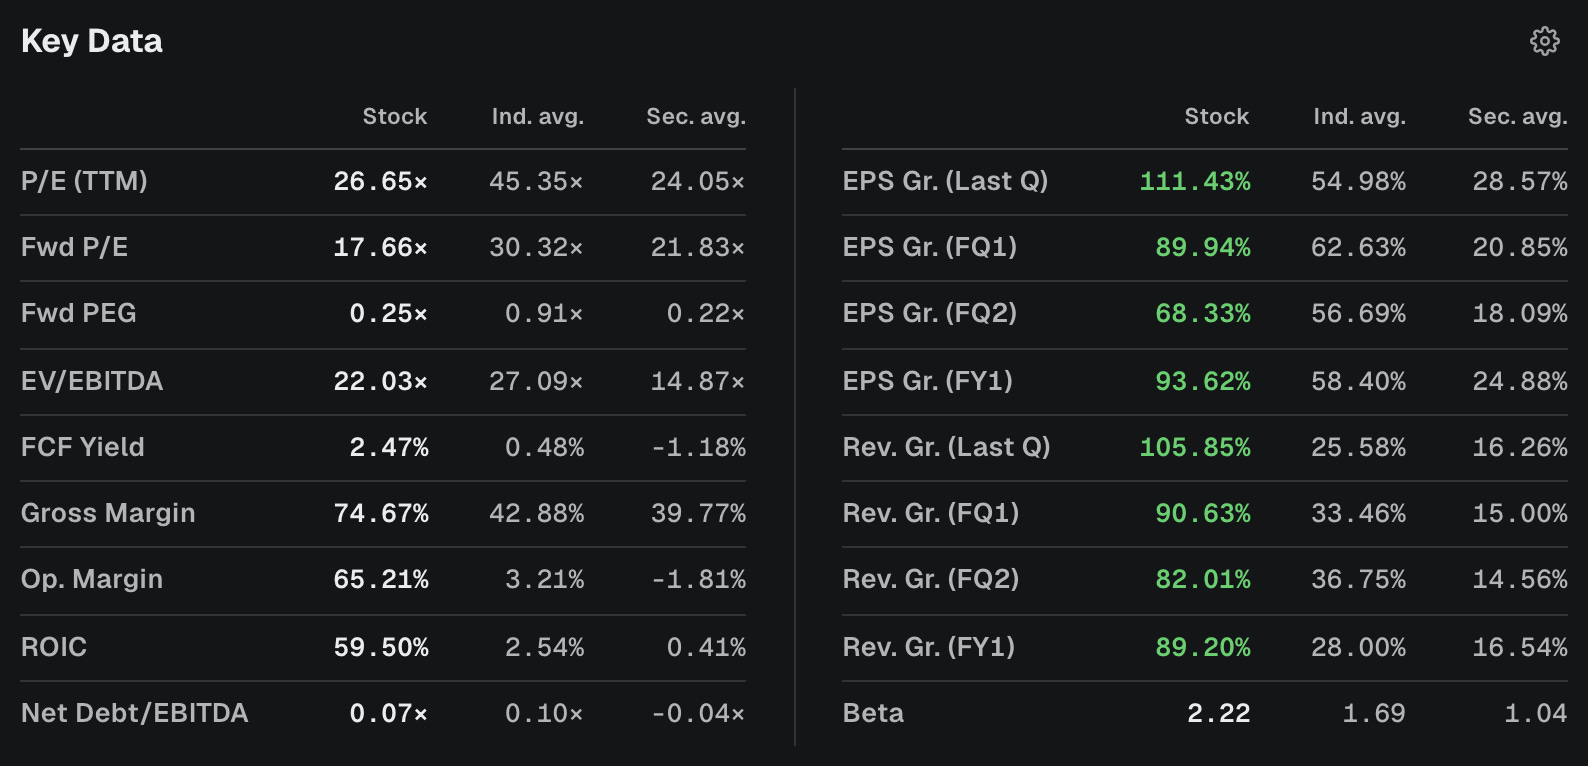
A 15% ROIC does not mean the same thing in every industry.
Some businesses naturally require much more capital.
Utilities, airlines, industrial manufacturers and telecom infrastructure often need significant physical investment.
Software and other asset-light businesses can sometimes scale with much less incremental capital.
So the better question is not:
Is 15% ROIC good?
It is:
How does 15% compare with companies operating under similar economics?
That is why rhope shows company metrics beside industry and sector reference points, on every stock page.
A 12% ROIC may be weak in one industry and strong in another.
Read ROIC with growth and valuation
High ROIC is not enough by itself.
Suppose:
Company A
ROIC: 30%
Revenue growth: 2%
Forward P/E: 40×
Company B
ROIC: 18%
Revenue growth: 20%
Forward P/E: 20×
Which one is better?
There is no automatic answer.
Company A may be an exceptional mature business with limited reinvestment opportunities.
Company B may earn lower returns today but have a much larger runway for growth.
And even if Company A is clearly the better business, that does not mean it is the better investment at any price.
This is the distinction that matters:
Business quality and valuation are separate questions.
ROIC helps with the first one.
It does not answer the second.
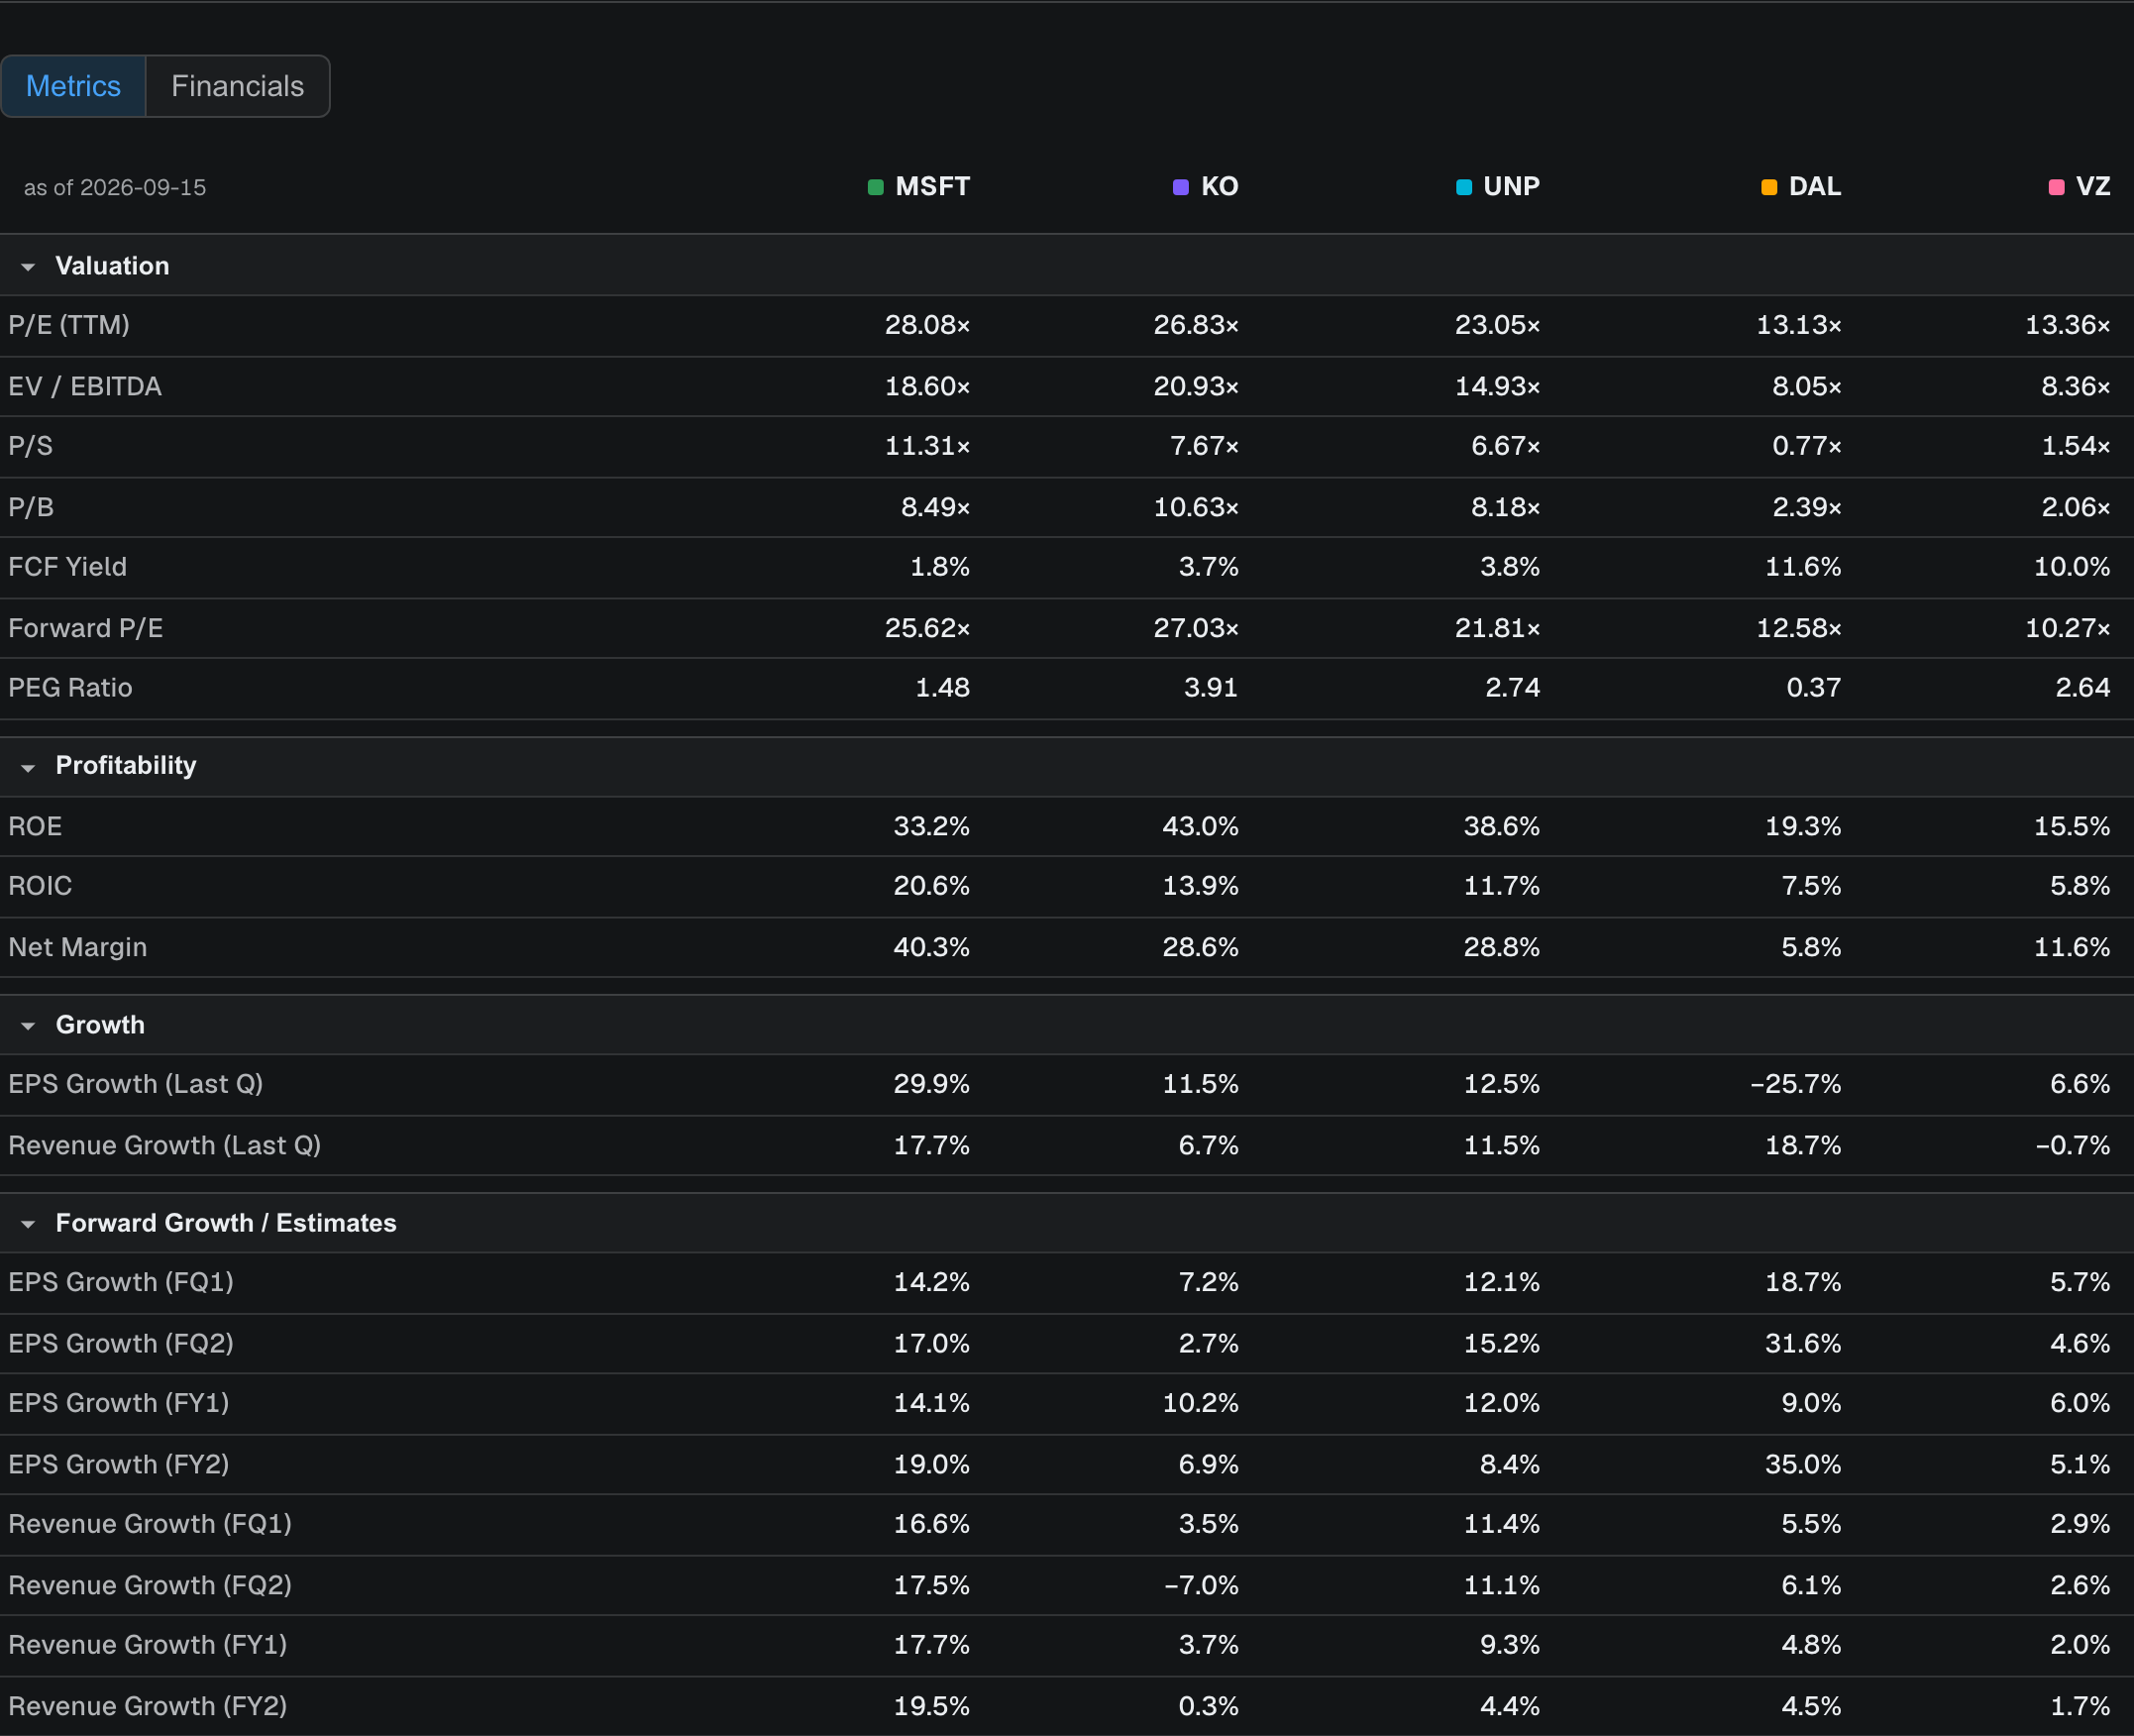
That is why it becomes more useful when read beside:
revenue and EPS growth;
margins;
forward P/E;
free-cash-flow yield;
balance-sheet strength.
Watch the direction, not only the level
The current ROIC matters.
The trend matters too.
A company moving from:
9% → 12% → 16% → 20%
may be becoming much more efficient.
A company moving from:
30% → 25% → 19% → 14%
may still show a strong headline number, but the deterioration deserves attention.
Changes in ROIC can reflect:
margin expansion or compression;
better or worse capital efficiency;
acquisitions;
capital-intensive expansion;
pricing power;
competitive pressure.
A snapshot tells you where the company is.
The trend can tell you where the economics are moving.
ROIC is a lens, not a score
It is tempting to simplify the metric into:
High ROIC = good company.
That is too easy.
A more useful set of questions is:
Is ROIC high relative to peers?
Is it sustainable?
Is it improving or deteriorating?
Can the company reinvest at similar returns?
Is growth still attractive?
What valuation is the market assigning to that quality?
ROIC is powerful because it connects profit with the capital required to produce it.
The return matters. So does the capital behind it.
That is what makes ROIC worth checking when comparing businesses.
I write these notes to explain how the numbers in the workspace are made, how to read them, and where they fit — never to tell you where a market or a stock will go.
Continue with rhope
Find a stock →
Compare companies →
Open Screener →
Sources
The worked examples are illustrative. None is a quote for any security.
Screenshots show company figures as displayed in the rhope workspace.
Descriptive only — nothing here is investment advice, a recommendation, or a trading signal. See our Terms.