

A single option is easy to describe.
A long call gives you upside exposure above a strike.
A long put gives you downside exposure below a strike.
The moment you add a second leg, the trade changes.
Your upside may become capped.
Your downside may become limited.
Your breakeven moves.
Your cost changes.
Your exposure to volatility and time changes too.
That is why multi-leg options trades are easier to understand as a single payoff structure, not as two separate contracts.
The legs create the trade. The payoff curve shows what the trade actually does.
Start with the shape, not the strategy name
Consider a simple bull call spread.
You:
buy one call at a lower strike;
sell one call at a higher strike;
use the same expiration date.
For example:
Buy 100 Call
Sell 110 Call
Suppose the net cost of the spread is:
$3.00
You now have a position whose behavior is very different from owning the 100 call by itself.
The long call gives you upside exposure.
The short call helps pay for it.
But in exchange, the short call also caps the upside.
This is the first important idea:
Adding a second leg usually means giving something up in exchange for something else.
In this case:
Lower cost
in exchange for
Limited upside
That trade-off is much easier to see on a payoff chart than in an option chain.
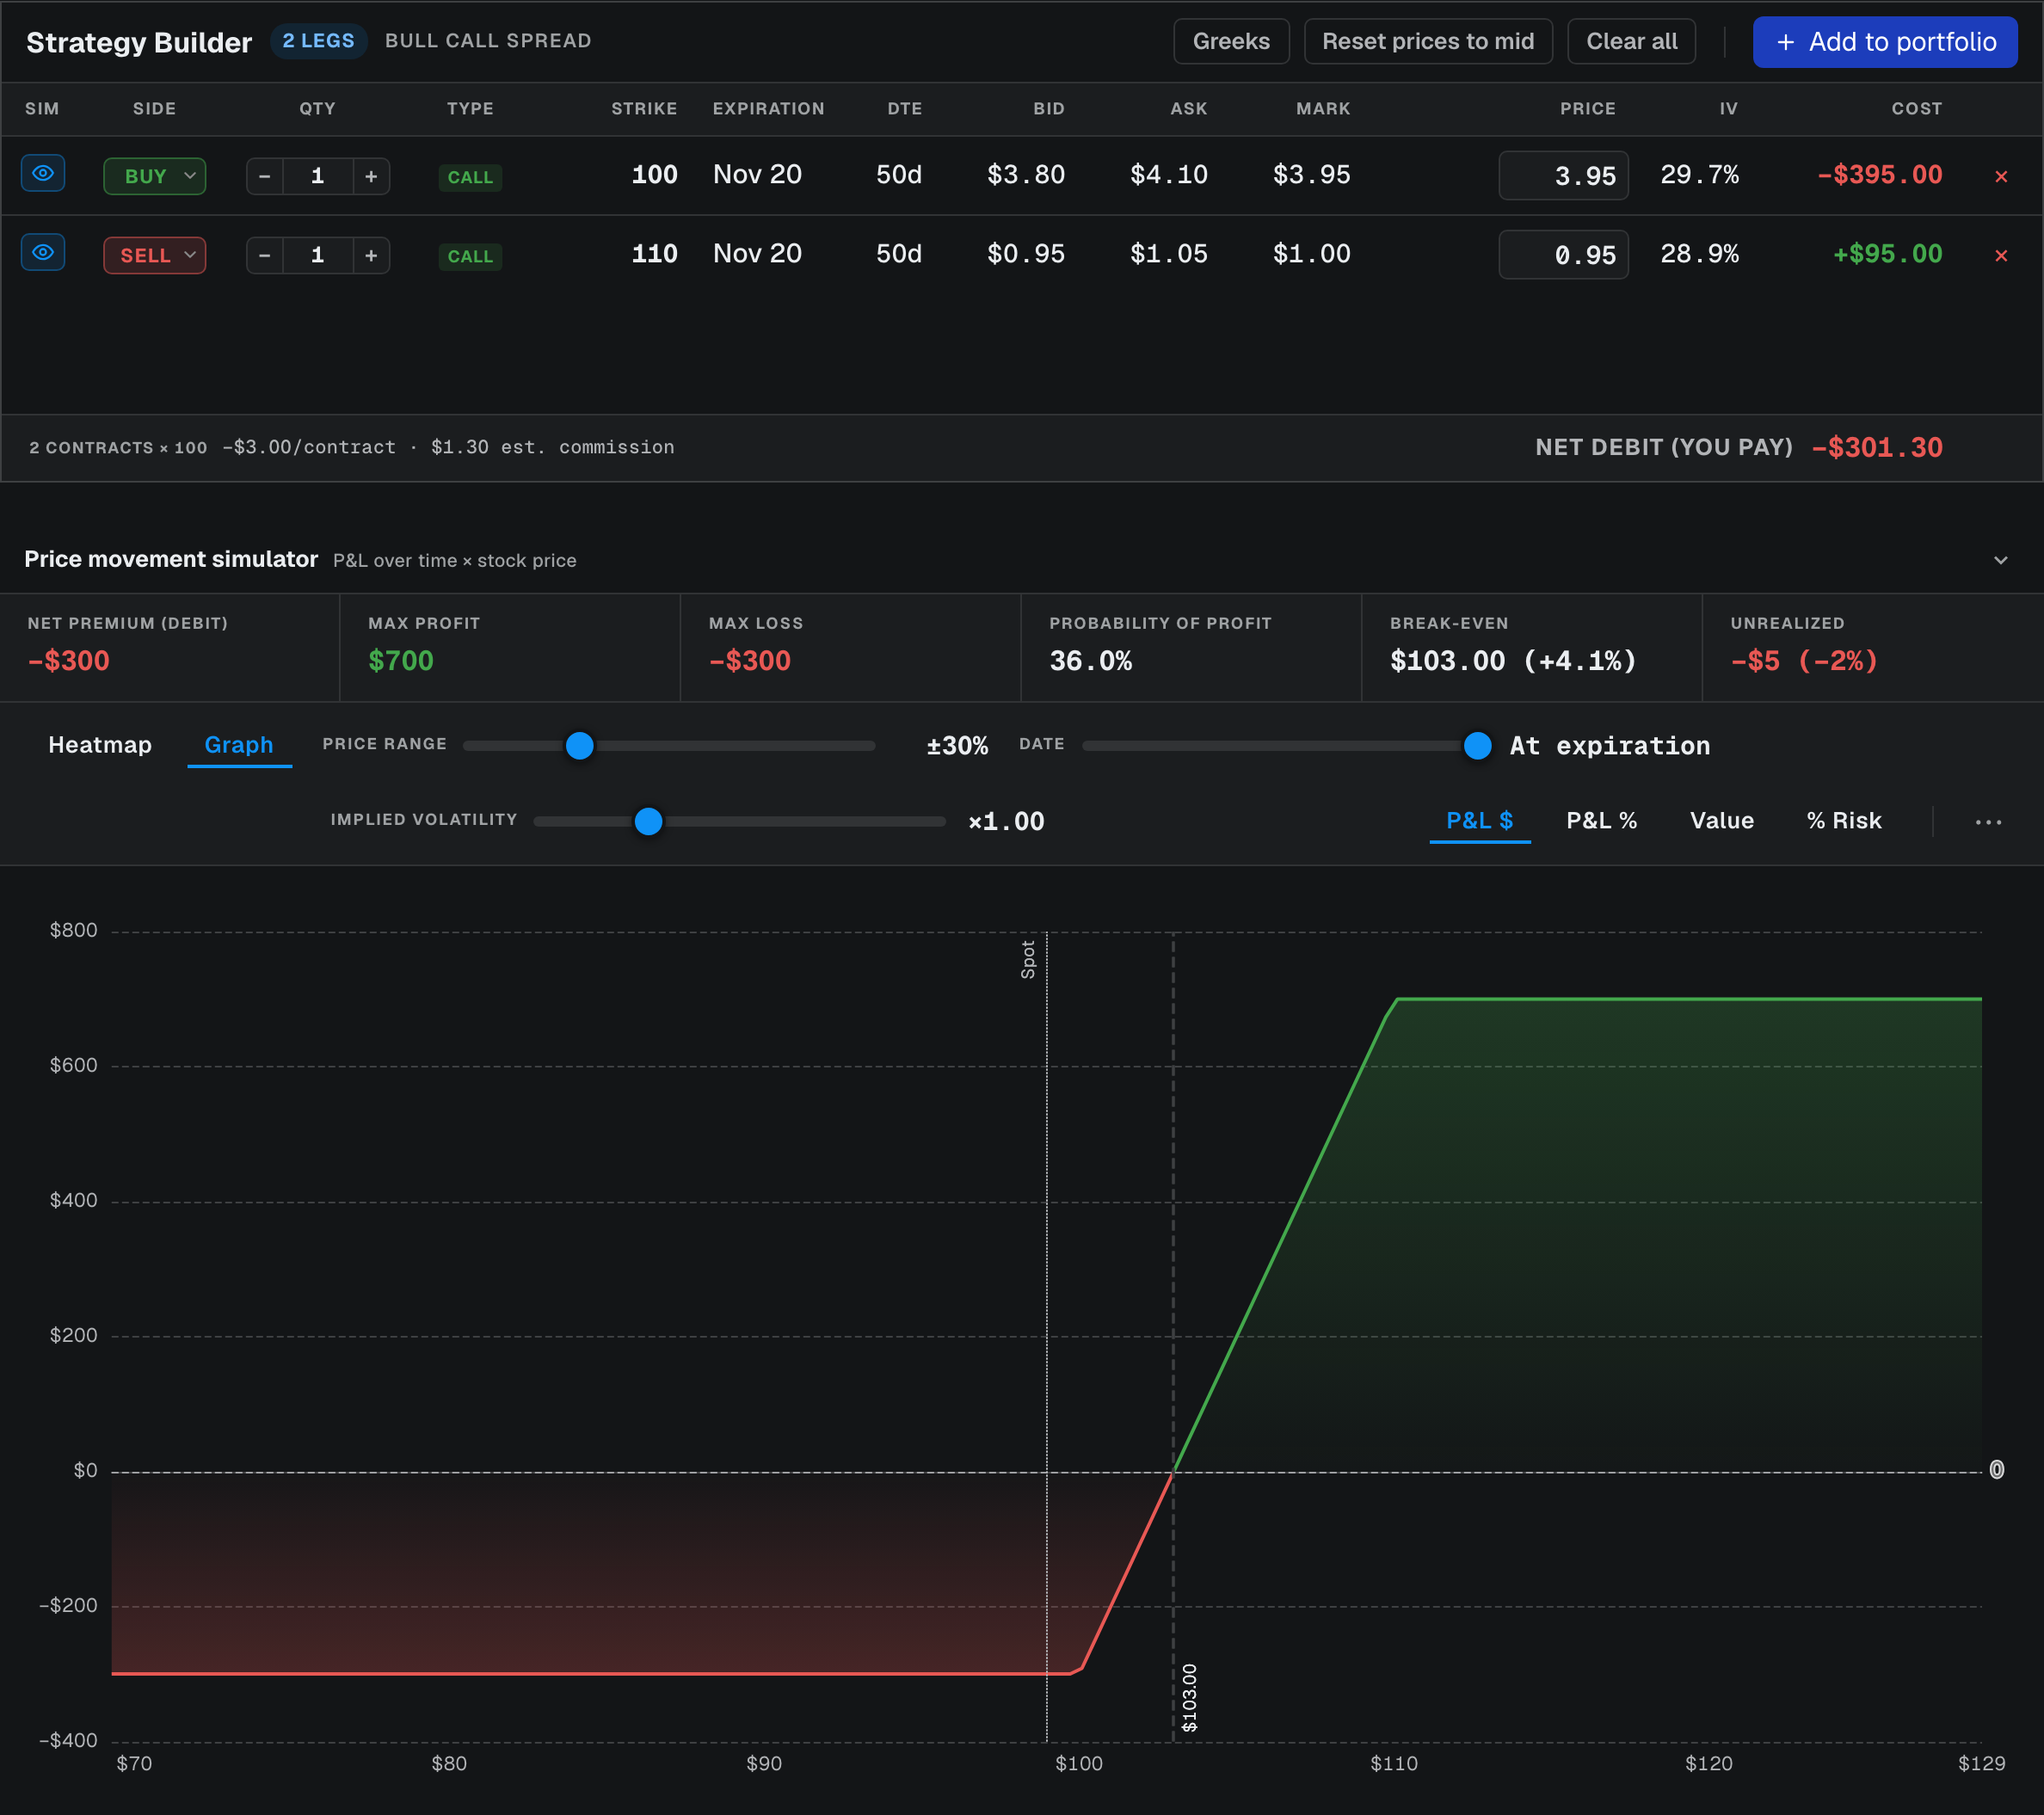
Read the three levels first
For a basic vertical spread, I usually start with three numbers:
Maximum loss
The most you can lose if the trade finishes below the long strike.
If the spread costs $3.00, the maximum loss is:
$3.00 per share
or:
$300 per contract spread
before commissions and fees.
Breakeven
For this example:
Long strike + net debit
So:
$100 + $3 = $103
At expiration, the stock needs to be above $103 for the position to show a profit.
Maximum profit
The spread width is:
$110 - $100 = $10
Subtract the $3 debit:
$10 - $3 = $7
So the maximum profit is:
$7 per share
or:
$700 per spread
Those three numbers already tell you most of the structure.
The second leg changes the economics
It is tempting to think of the short call only as a way to reduce the price of the long call.
That is only half the story.
Without the short 110 call, the long 100 call has theoretically unlimited upside.
With the short call added, gains stop increasing once the stock is above 110 at expiration.
So the trade becomes more capital-efficient.
But it also becomes more specific.
You are no longer saying:
I want unlimited upside exposure.
You are saying something closer to:
I think the stock can rise, but I am willing to give up gains above a certain level in exchange for paying less today.
That is a different thesis.
The structure should match the view.
A better payoff can still be a worse trade
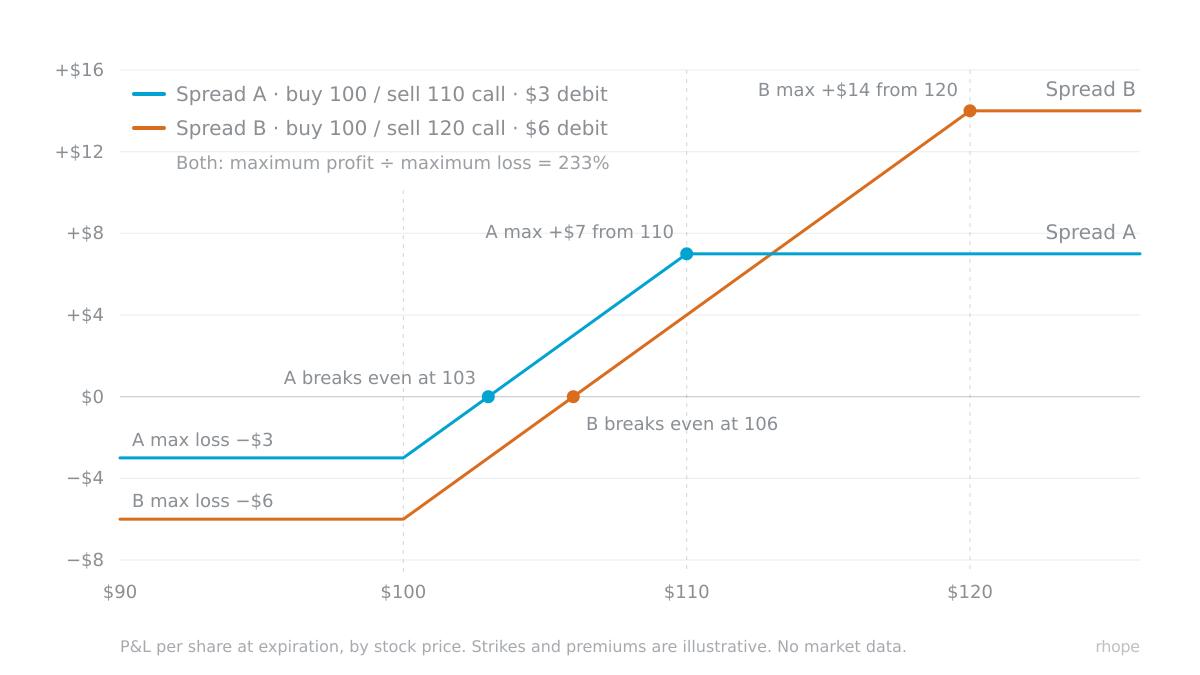
Suppose you compare two spreads.
Spread A
Buy 100 Call
Sell 110 Call
Cost: $3
Maximum profit:
$7
Maximum loss:
$3
Potential return on risk:
233%
Spread B
Buy 100 Call
Sell 120 Call
Cost: $6
Maximum profit:
$14
Maximum loss:
$6
Potential return on risk:
233%
At first glance, they look similar.
But they are not.
Spread B requires the stock to travel much further before reaching maximum profit.
Spread A gives up upside earlier, but asks less from the stock.
So the better question is not:
Which spread has the larger maximum profit?
It is:
What price path does each structure require for the return to become real?
That is where the payoff curve becomes useful.
It lets you compare the reward with the distance required to reach it.
Expiration payoff is not the whole story
A payoff chart is usually easiest to read at expiration.
But options move before expiration too.
Before the final day, the position is affected by:
the stock price;
implied volatility;
time remaining;
delta;
theta;
changes in each individual leg.
A spread can therefore show a profit or loss before expiration that does not match the final payoff line exactly.
This matters especially when:
the stock moves quickly;
volatility changes sharply;
the short leg moves close to the money;
there is still significant time remaining.
The expiration curve tells you the destination.
The option Greeks help explain the path.
Defined risk does not mean low risk
Multi-leg spreads are often described as defined-risk trades.
That is true in the sense that the maximum loss can be known in advance.
But a defined maximum loss can still be a large percentage of the capital committed.
In the earlier example:
Risk: $3
Maximum profit: $7
If the stock finishes below 100, the entire $3 can be lost.
So “defined risk” should not be confused with “small risk.”
The useful question is:
Is the amount at risk reasonable for the probability, payoff and thesis?
The payoff simulator can show the boundary.
It cannot decide whether the risk is appropriate for you.
Read the curve as a thesis
A payoff curve is more than a visual summary of an options strategy.
It is a picture of what your thesis requires.
A bull call spread says:
I expect upside;
I want to reduce the upfront cost;
I am comfortable capping gains;
I have a price range in mind;
I accept losing the debit if the move does not happen.
A bear put spread expresses the same logic in the opposite direction.
Other multi-leg strategies create different shapes because they express different combinations of:
direction;
volatility;
time;
probability;
payoff.
That is why I prefer reading the curve before focusing on the strategy name.
The name tells you what the structure is called.
The curve tells you what has to happen.
The structure should match the view
When you add a second option leg, you are not simply adding another contract.
You are changing the trade.
The second leg can:
reduce cost;
cap upside;
limit downside;
move the breakeven;
change the effect of volatility and time.
That is why the position should be evaluated as a whole.
The legs explain how the trade is built. The payoff curve explains what the trade is asking the market to do.
Before entering a multi-leg options position, the useful questions are:
What is the maximum loss?
Where is the breakeven?
Where does profit stop increasing?
How far does the underlying need to move?
What am I giving up in exchange for reducing cost or risk?
Does the structure actually match the thesis?
Once those questions are visible, the trade becomes much easier to reason about.
I write these notes to explain how the numbers and tools in the workspace are made, how to read them, and where they fit — never to tell you where a market or a stock will go.
Continue with rhope
Open Payoff Simulator →
View Options Chain →
Find a stock →
Sources
The worked examples are illustrative. None is a quote for any security.
The simulator screenshot uses a live option chain with both fills entered by hand, inside the quoted bid and ask, to match the $3.00 example.
Descriptive only — nothing here is investment advice, a recommendation, or a trading signal. See our Terms.