

Macro data can feel contradictory.
Employment is strong.
Manufacturing is weakening.
Inflation is falling.
Credit conditions are tightening.
The stock market is rising.
Which one matters?
Usually, all of them — but they are describing different parts of the cycle.
Some indicators tend to change before the broader economy.
Some move with it.
Others confirm what has already happened.
That is why macro data is more useful when it is organized by timing, not just by topic.
The question is not only what the data says. It is where the data sits in the cycle.
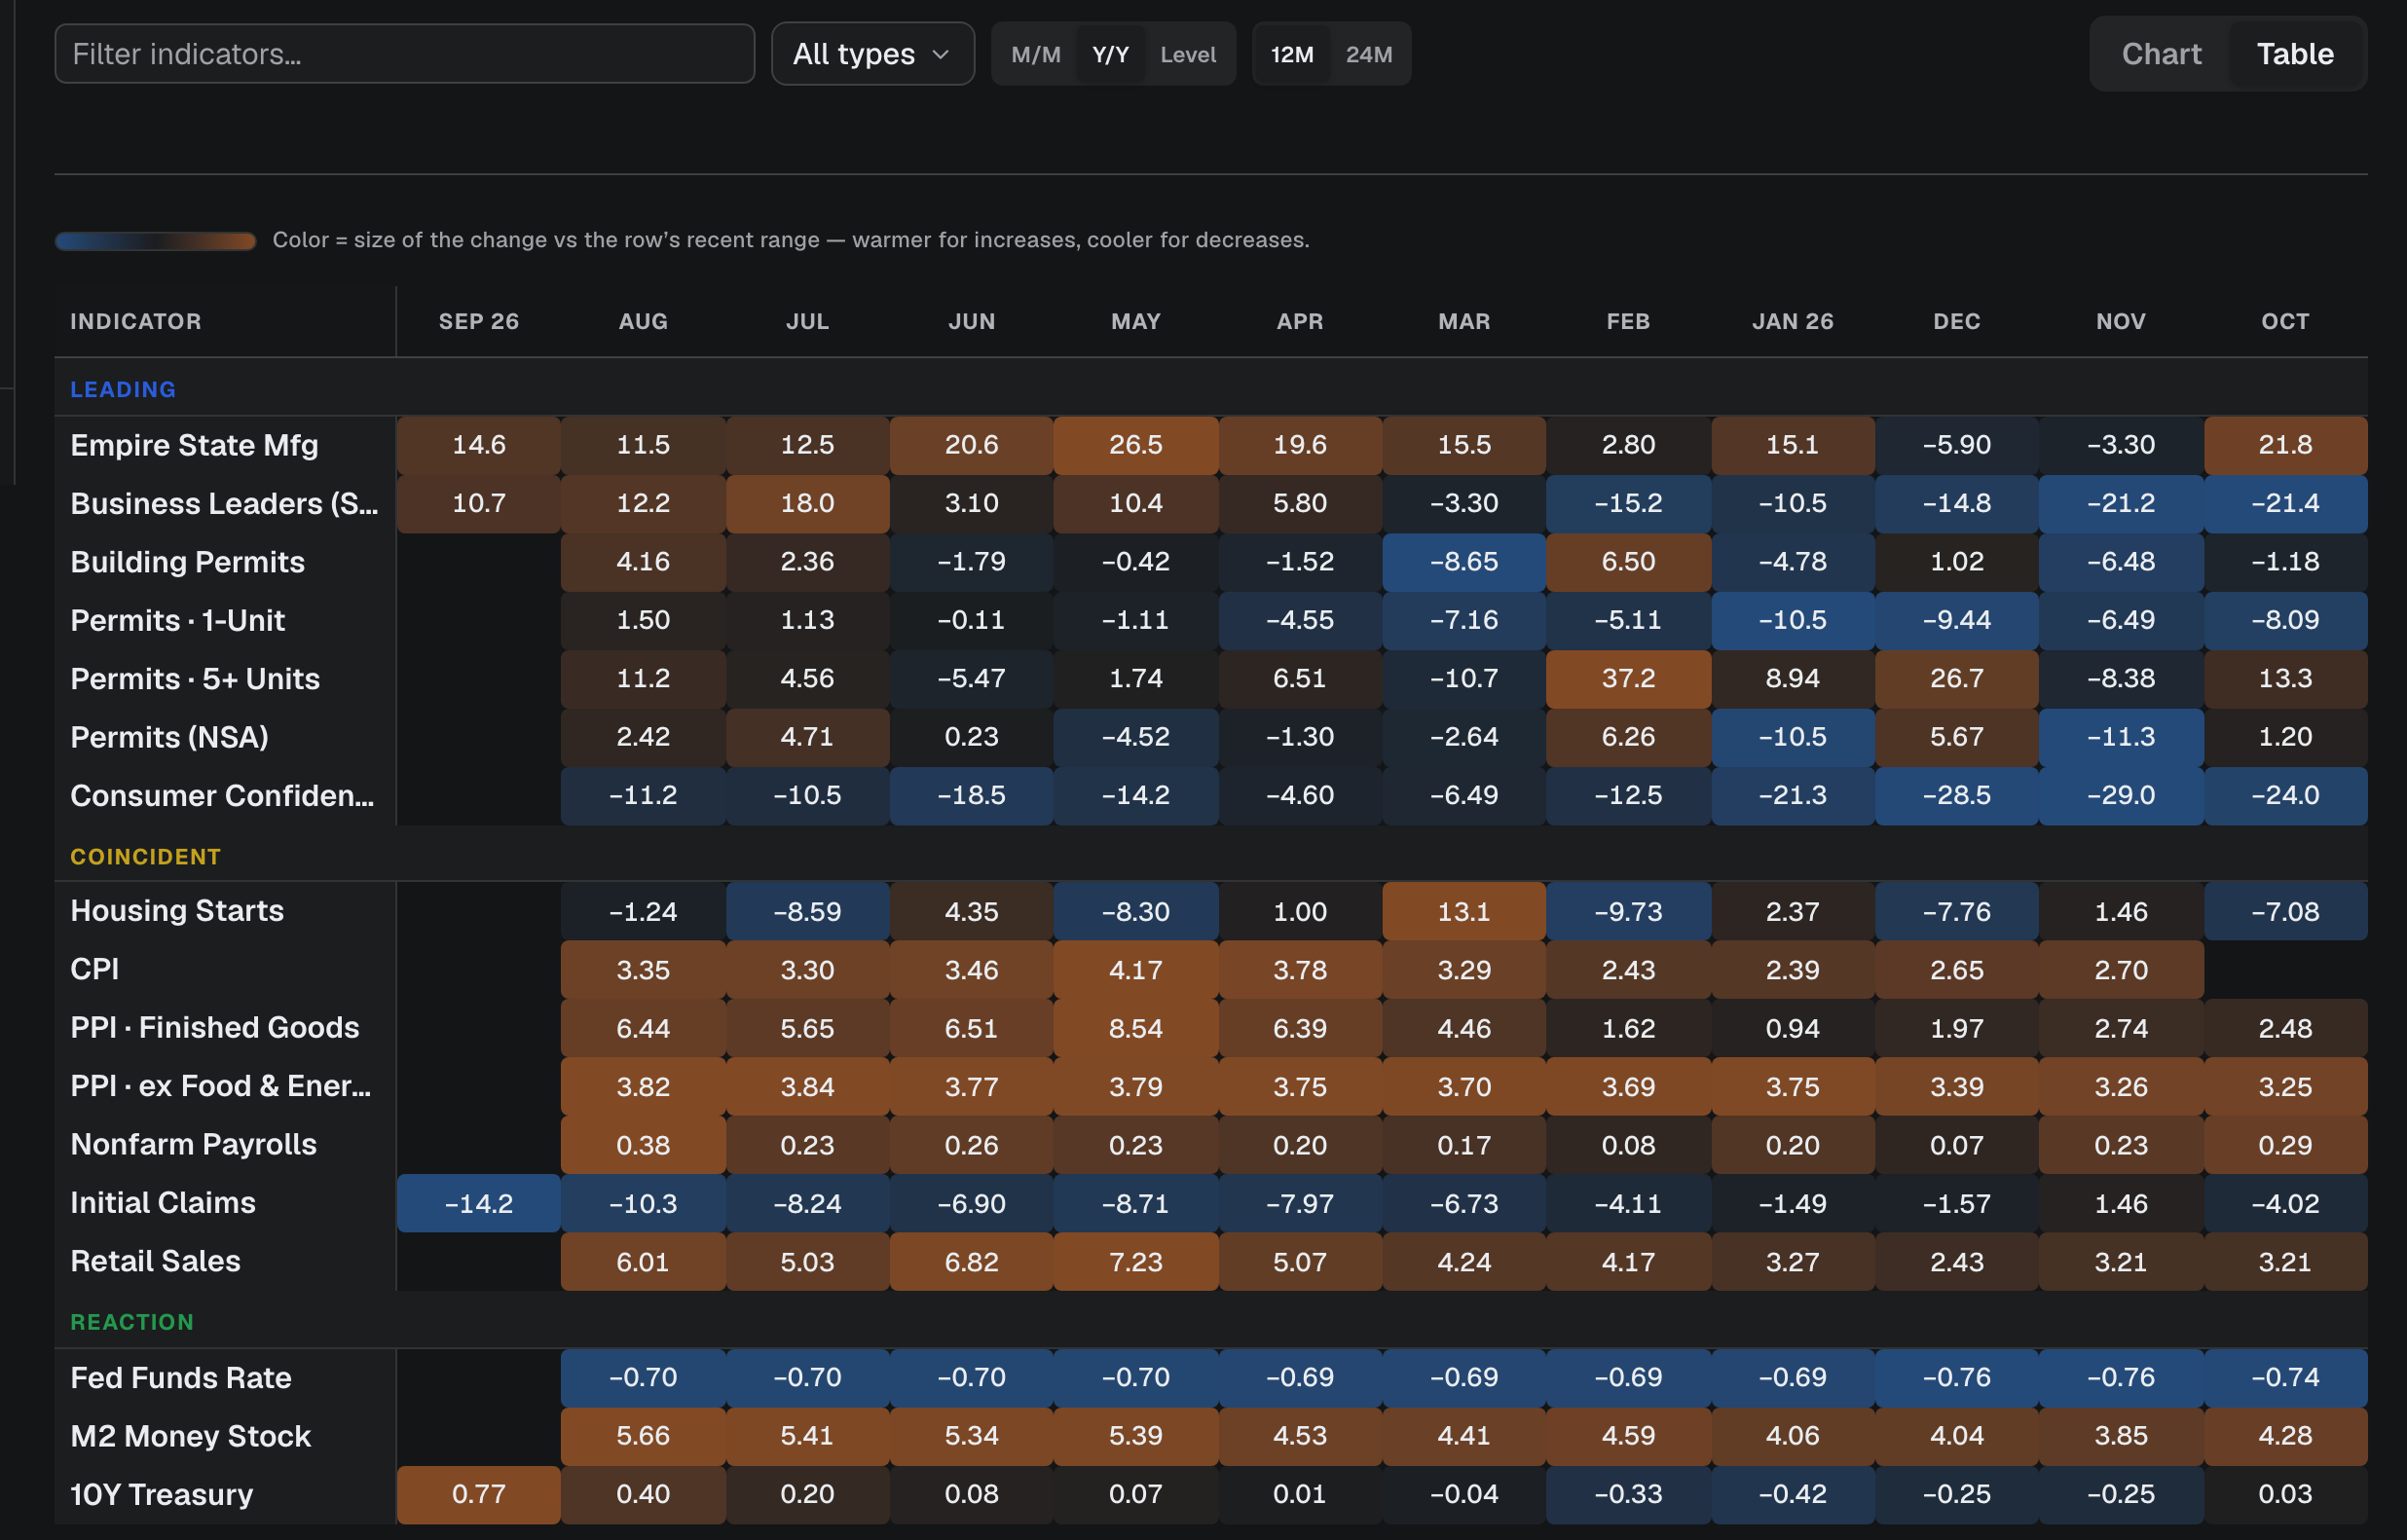
Leading indicators: what may happen next
Leading indicators tend to change before the broader economy.
They are not forecasts in the strict sense, and they do not predict every recession or recovery correctly.
But they can show whether the environment is becoming more supportive or more restrictive.
Examples include:
new orders in business surveys;
building permits;
initial unemployment claims;
consumer expectations;
financial conditions;
credit spreads;
the yield curve;
selected composite leading-indicator indexes.
The common idea is simple:
Leading indicators try to capture decisions being made before they fully appear in output, employment or earnings.
A company cuts new orders before production falls.
Housing permits weaken before construction activity slows.
Credit conditions tighten before some borrowers reduce spending or investment.
That makes leading indicators especially useful when the current economy still looks healthy but the direction underneath is changing.
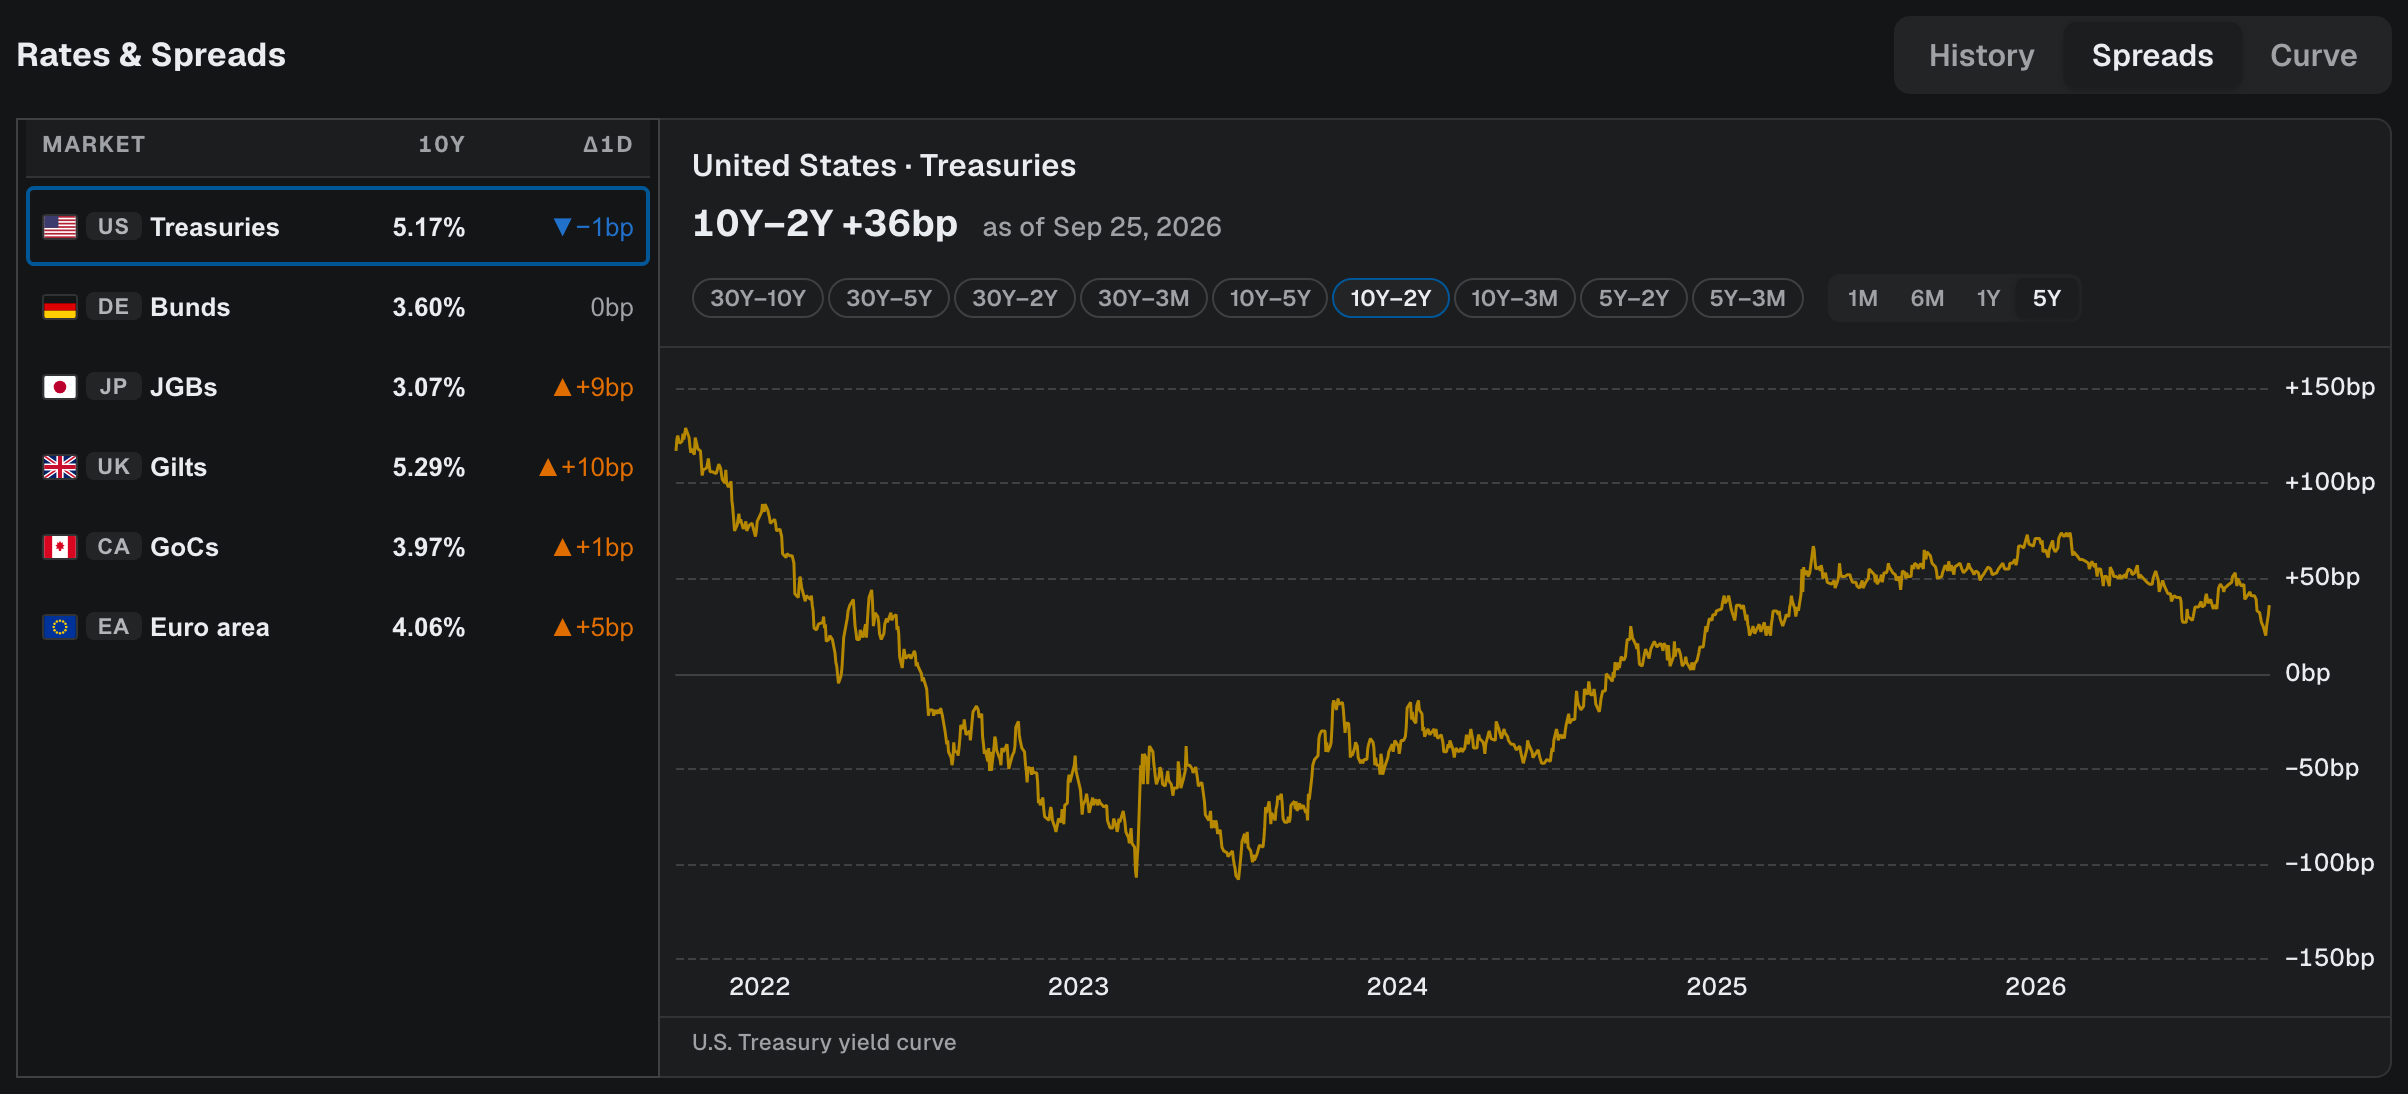
The yield curve is one leading signal, not the whole story
The yield curve receives a lot of attention because inversions have historically appeared before many U.S. recessions.
The intuition is that short-term rates can become restrictive while longer-term yields reflect weaker future growth and inflation expectations.
But the yield curve should not be used as a countdown clock.
An inversion does not tell you:
exactly when a recession will begin;
how deep it will be;
what equities will do next month;
whether every part of the economy is weakening.
And once the curve begins to steepen again, the interpretation can depend on why it is steepening.
Long yields rising because growth expectations improve is different from short yields falling because the market expects aggressive rate cuts.
The shape matters.
The reason behind the shape matters more.
Business surveys can show turning points early
PMI and ISM surveys are useful because they ask companies what is happening now across orders, production, employment and prices.
Within those surveys, some components can be especially informative.
For example:
New Orders can weaken before production does.
That makes intuitive sense.
Fewer orders today can mean less production later.
Similarly, changes in:
supplier deliveries;
inventories;
employment intentions;
prices paid;
can help show whether demand, supply pressure and business activity are accelerating or slowing.
The headline index is useful.
The internal components often tell the better story.
A macro indicator becomes more useful when you can see what is driving it.
Coincident indicators: what the economy is doing now
Coincident indicators tend to move broadly with current economic activity.
Examples include:
payroll employment;
industrial production;
real income;
business sales;
broader measures of current output.
These are useful because they help answer:
Is the economy actually expanding or contracting right now?
The distinction matters.
A leading indicator can weaken for months while coincident data remains strong.
That does not mean the leading indicator is useless.
It means the expected slowdown has not yet fully reached current activity.
This is one reason macro turning points can be difficult to trade.
The economy can still look healthy at the same time that the forward-looking data is deteriorating.
Lagging indicators: confirmation after the turn
Lagging indicators usually react after a broader economic shift is already underway.
Examples can include:
some measures of inflation;
unemployment-related measures;
credit delinquencies;
wage pressure;
certain corporate financing stresses.
These indicators are still important.
They simply answer a different question.
For example, inflation may remain elevated even after demand has begun to slow.
Unemployment can remain low until companies finally decide that weaker demand is persistent enough to reduce hiring or cut workers.
That is why waiting for every lagging indicator to deteriorate can mean waiting until much of the economic shift has already occurred.
Lagging data often confirms the cycle. It rarely identifies the turn first.
Direction matters more than a single reading
Suppose manufacturing PMI is:
48.2
A reading below 50 is commonly associated with contraction in survey activity.
But the direction matters.
If PMI moved:
55 → 52 → 49 → 46
the environment is deteriorating.
If it moved:
42 → 44 → 46 → 48
activity may still be weak, but the direction is improving.
Those are very different macro setups.
The same applies to:
unemployment claims;
inflation;
credit spreads;
housing activity;
consumer expectations;
earnings revisions.
The level tells you where you are.
The trend tells you where you may be going.
Think in clusters, not single indicators
No macro indicator works perfectly.
That is why the better approach is to look for confirmation across groups.
Imagine the following setup:
Leading
new orders falling;
building permits weakening;
credit spreads widening;
initial claims beginning to rise.
Coincident
payrolls still positive;
industrial production flat;
consumer spending still holding up.
Lagging
unemployment still low;
inflation still elevated.
This is not contradictory.
It can describe an economy moving from strength toward weakness.
Now imagine the reverse:
Leading
new orders improving;
claims falling;
financial conditions easing;
housing activity stabilizing.
Coincident
output still weak;
payroll growth slowing.
Lagging
unemployment still rising;
inflation continuing to fall.
That can describe an economy beginning to recover before the lagging data confirms it.
The point is not to label every environment perfectly.
It is to understand which part of the cycle each indicator is describing.
Markets and the economy are not the same thing
There is one more complication.
Financial markets are forward-looking too.
Stocks can begin falling before the economic data weakens.
They can also begin rising while current economic data still looks terrible.
That is because markets are constantly repricing:
future growth;
inflation;
interest rates;
liquidity;
earnings;
risk.
So a weakening economy does not automatically mean falling stocks.
And improving economic data does not automatically mean rising stocks.
The market may have already priced the change.
This is the same principle we use when reading earnings:
The reaction depends on the gap between reality and expectations.
Macro works the same way.
A practical macro framework
When reading the economy, I find it useful to ask four questions.
1. What is leading?
Are forward-looking indicators improving or deteriorating?
2. What is happening now?
Do coincident indicators confirm the same direction?
3. What is still lagging?
Which indicators are describing the previous phase of the cycle?
4. What has the market already priced?
Are rates, equities, credit and commodities already reflecting the expected change?
That framework is more useful than trying to make one number carry the entire macro view.
Leading indicators suggest where the cycle may be going. Coincident indicators show where it is. Lagging indicators tell you what has already happened.
The research begins when you put all three together.
I write these notes to explain how the numbers in the workspace are made, how to read them, and where they fit — never to tell you where a market or a stock will go.
Continue with rhope
Open Macro →
View Market Overview →
Check Key Events →
Sources
The PMI readings in the worked examples are illustrative, not observations.
Screenshots show indicator values as displayed in the rhope workspace. Economic series are from FRED (Federal Reserve Bank of St. Louis); Treasury yields are the U.S. Treasury yield curve.
Descriptive only — nothing here is investment advice, a recommendation, or a trading signal. See our Terms.