

A stock trades at 20× forward earnings.
Is that expensive?
Not necessarily.
If its industry trades at 12×, maybe.
If its industry trades at 35×, maybe not.
The number has not changed.
The context has.
That is the problem with looking at financial metrics in isolation. A P/E ratio, growth rate, margin or ROIC can be perfectly accurate and still tell you very little on its own.
The number is the starting point.
The comparison is where the research begins.
A number is not a conclusion
Financial data is full of numbers that look self-explanatory:
P/E
Forward P/E
EV / EBITDA
FCF yield
Revenue growth
EPS growth
ROIC
Net margin
But none of them automatically tell you whether a company is attractive, expensive, efficient, high quality or weak.
Take forward P/E.
A stock at 18× can look cheap.
But if similar companies trade at 11×, the stock may actually be expensive relative to its peers.
A stock at 30× can look expensive.
But if its industry trades at 42× and the company is growing faster with better margins, the premium may be easier to explain.
The number is real.
The interpretation depends on what you compare it with.
The reference point matters
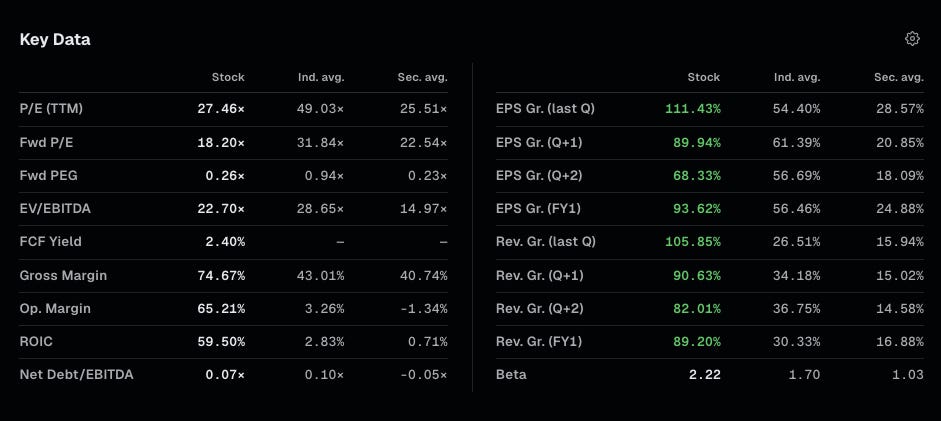
In rhope, company metrics are shown beside industry and sector reference points, on every stock page.
That is deliberate.
Each comparison answers a slightly different question.
Stock vs industry
This tells you how the company compares with businesses that are usually more similar operationally.
For example:
a semiconductor company vs other semiconductor companies;
an airline vs other airlines;
a residential builder vs other residential builders.
This is often the most useful first comparison.
Stock vs sector
This gives you a broader reference point.
A company may look expensive relative to its industry but cheap relative to the wider sector.
Or the opposite.
The sector comparison is less specific, but it helps show whether the entire industry is being valued differently from the broader market.
Neither comparison tells you what to buy.
They tell you whether a number is ordinary or unusual.
Cheap relative to what?
Suppose a company trades at:
Forward P/E: 18×
Industry: 27×
At first glance, the stock looks cheap.
But now add growth:
FY1 revenue growth: 3%
Industry: 14%
The discount has a possible explanation.
The market may simply be paying less for slower growth.
Now consider another company:
Forward P/E: 30×
Industry: 22×
This one looks expensive.
But add:
FY1 EPS growth: 40%
Industry: 16%
The premium also has a possible explanation.
The point is not that one company is cheap and the other is expensive.
The point is that valuation and fundamentals have to be read together.
A low multiple can be deserved.
A high multiple can be justified.
And sometimes the gap between price and fundamentals is where the interesting question begins.
What should be compared together?
Some metrics become much more useful when paired with another one.
If you look at… Also check…
P/E EPS growth
Forward P/E forward EPS growth and estimate revisions
FCF yield cash-flow quality and capital intensity
ROIC margins and reinvestment needs
Revenue growth profitability
Net margin industry economics
Industry discount why the discount exists
Industry premium whether growth or quality supports it
This does not mean every metric needs an exact formula or score.
It means one number should rarely be allowed to carry the entire argument.
Context can explain the discount
One of the most useful research questions is:
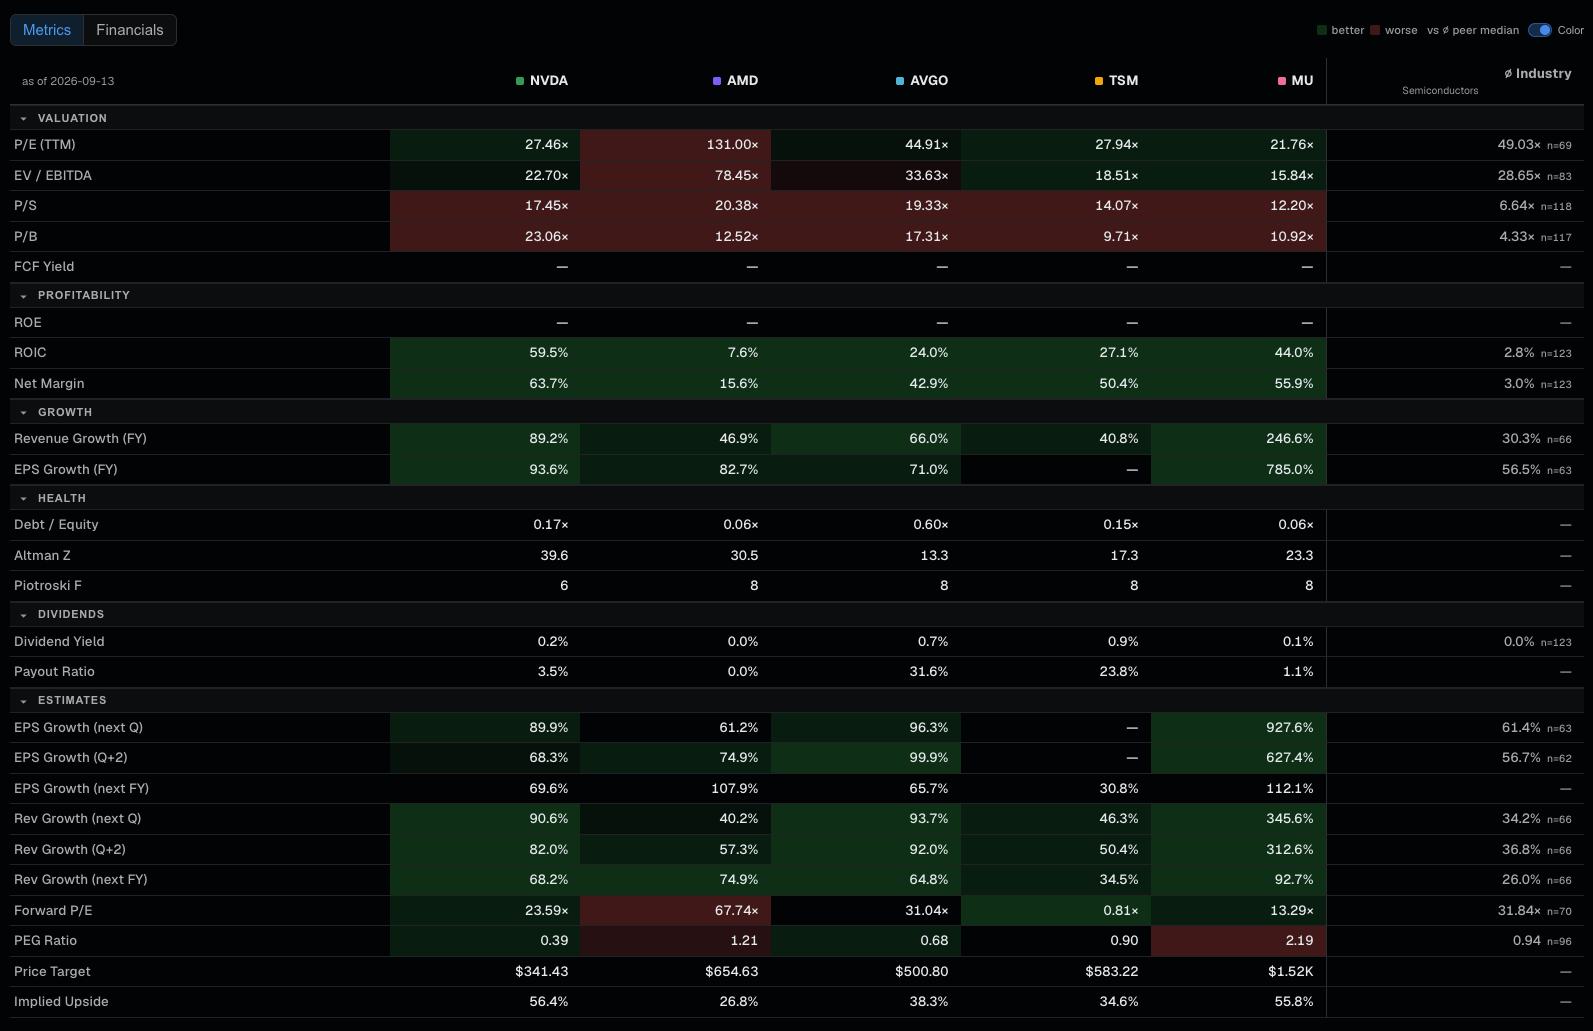
Why is this company valued differently from its peers?
Sometimes the answer is obvious:
slower growth;
weaker margins;
higher debt;
more cyclicality;
greater capital intensity;
lower returns on capital.
Sometimes the answer is less obvious.
That is where comparison becomes useful.
Imagine two companies in the same theme.
One trades at a much lower forward P/E but has:
higher ROIC;
stronger margins;
faster expected revenue growth.
That does not automatically make it the better investment.
But it creates a question worth investigating:
What risk is the market pricing that is not obvious from the headline metrics?
That question is more useful than simply saying:
“This stock is cheap.”
Context does not remove judgment
There is a danger in taking comparisons too far.
An industry average is not a fair value.
A sector average is not a target.
A stock trading below its peers is not automatically undervalued.
And a company trading above its peers is not automatically overvalued.
Entire industries can become expensive.
Entire sectors can become cheap.
A company can deserve a discount for reasons that do not fit neatly into a table.
That is why rhope does not try to reduce research to a single score.
The purpose is simpler:
make the relationships visible.
You still have to decide which differences matter.
The same idea applies beyond valuation
This principle is not limited to P/E ratios.
Growth
A company growing revenue at 10% may look strong until you see that its industry is growing at 25%.
Profitability
A 20% net margin may look excellent in one industry and ordinary in another.
ROIC
A 15% ROIC may be impressive for a capital-intensive business and mediocre for a software company.
Earnings
A company can beat estimates and still fall if expectations for the next quarter move lower.
Sector performance
A sector can be positive over three months and still be losing leadership over the last week.
The number is still useful.
It just becomes more useful when you know what it is being measured against.
The research starts with the comparison
A number without context is just a measurement.
Research starts when you ask:
compared with what?
compared with whom?
compared with when?
and what expectations are already reflected in the price?
That is one of the core ideas behind rhope.
The number is the starting point. The comparison is where the research begins.
The workspace is built to make that comparison easier to see — without making the decision for you.
I write these notes to explain how the numbers in the workspace are made, how to read them, and where they fit — never to tell you where a market or a stock will go.
Continue with rhope
Find a stock →
Compare companies →
Open Screener →
Sources
Every figure in the examples is illustrative. None is a quote for any security.
Descriptive only — nothing here is investment advice, a recommendation, or a trading signal. See our Terms.